| Tweet |
Note: The following article is meant to help you learn from the market and does not serve as investment advice for any specific group or individual. For more information, please read the HSR Terms of Use.
One of my goals with this site is to highlight different examples of price troughs within a basing phase using historical market analysis.
This will help you learn from price behaviors that set up before a base breakout.
With this in mind, I'm going to share one example with you right now.
This particular approach, which identifies potential troughs within a handle, is based on two common behaviors of stocks:
- Price Thrust
- Price Retracement
In order for you to learn how these two price behaviors fit together within a base, you must first understand the following statement about how stocks behave:
"Stocks rally (thrust) higher on expanding range/volume and then price may return to the original thrusting zone and bottom."
Where did I get this statement?
I put it together based on my studies of stock price behaviors.
You can read more about it in the Retracement to Prior Demand Week (PDW) behavior found here.
Like anything in the market, a Retracement to a PDW doesn't always catch a low, but it's a common behavior of price.
It can also be applied to different areas on a chart.
In this case, I'm going to apply it to the right-hand side of a base.
When dealing with the right-hand side of a base, I prefer to label a Retracement to Prior Demand Week (PDW) as a Right Side Curl with Reaccumulation.
There are 6 steps required to find potential handle troughs within bases using the Right Side Curl with Reaccumulation price behavior.
I know that sounds like a lot of steps, but I broke it up that way to make it easier for you to understand.
Less steps may leave you too confused.
Here are the 6 steps that may help you identify potential handle troughs using Right Side Curl with Reaccumulation:
Step 1: Confirm that you're in a market uptrend and not in a bear market.
Note: It's okay if you're in a correction within a market uptrend.
Step 2: Using a weekly chart, find a stock that's basing AND showing thrusting behavior coming off a low or as it's scaling the right-hand side of its base.
Note: A price thrust implies that there's competition for a stock. To find one, look for a week that shows both price range expansion and heavy volume.
Step 3: Wait for price to complete the right-hand side of its base and show signs it's running into resistance.
Note: Price may run into resistance close to its former high, but it can sometimes occur 10-20% below a high.
Step 4: Look for price to correct towards the price thrust identified in Step 2.
Note: Price should move downward from its high to form a handle on the base.
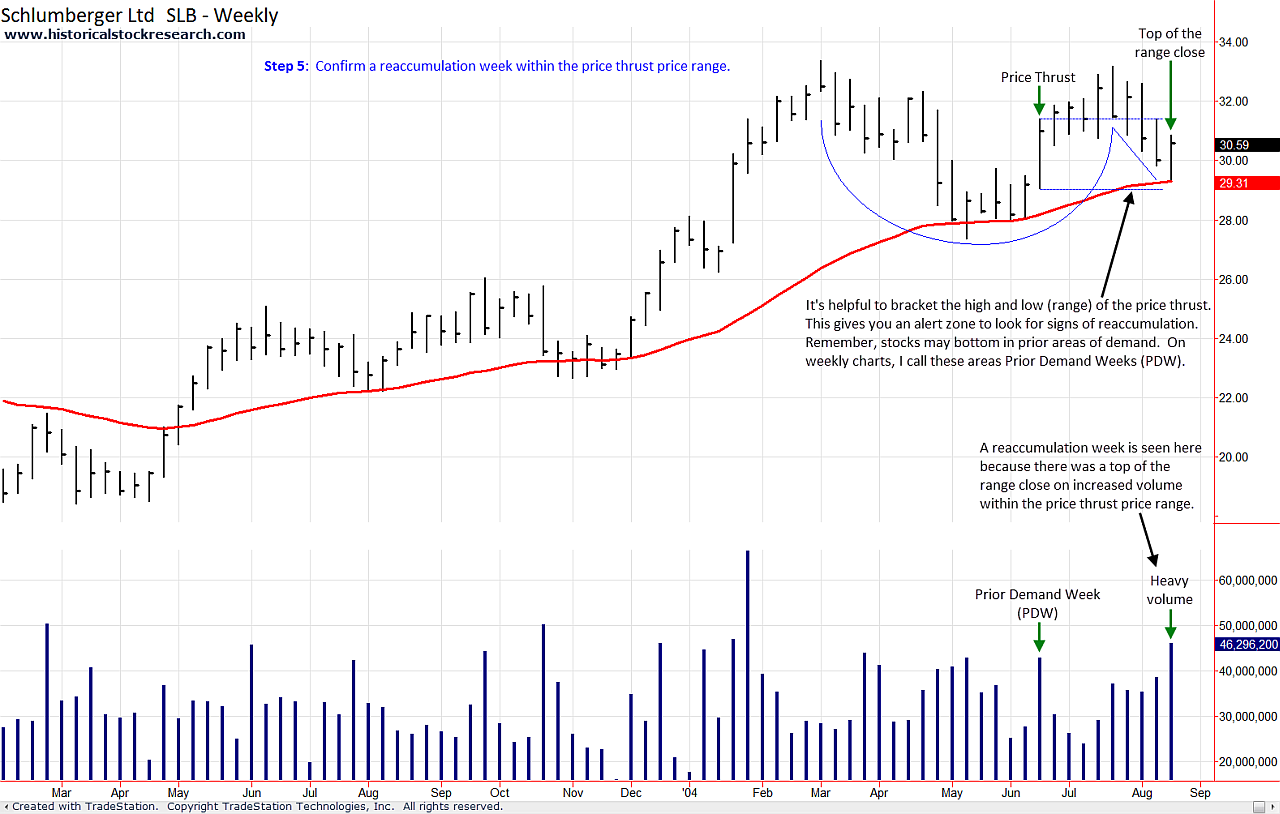
Step 5: Confirm a reaccumulation week within the price thrust price range.
To confirm reaccumulation, price must first make a new low, reverse and close at the mid-point or higher of the week's range on increased volume (from prior week). This price action should occur within the price thrust range from Step 2.
Note: In some cases, it may be helpful to bracket the high and low of the price thrust from Step 2. This will give you an alert zone to look for signs of reaccumulation.
Step 6: After confirming reaccumulation AND making a higher low in the subsequent weeks (before a new low is made), look for price to trade above the high of the reaccumulation week and begin to work its way out of the base.
Note: If the stock does trade above the high price of the reaccumulation week AND has registered a higher low, its formed a potential handle trough. Many times, you'll see several reaccumulation weeks as price corrects, however, if price doesn't trade above the high of the reaccumulation week (or makes a new low) then it's not a handle trough.
Here's the chart sequence for Steps 1-6:
Historical Stock Chart Examples (Steps 1-6): Schlumberger (SLB) 2004
|
Click for Step 1 |
Click for Step 2 |
Click for Step 3 |


|
Click for Step 4 |
Click for Step 5 |
Click for Step 6 |


Note: From this point forward, all charts supporting this article can be downloaded using the provided link that's located at the end of the last page.
How to Find Potential Handle Troughs within Bases
Note: This article is meant to help you learn from the market and does not serve as investment advice for any specific group or individual. For more information, please read the HSR Terms of Use.
Benefits of Learning How to Find Potential Handle Troughs within Bases
There are several benefits when you learn how to find potential handle troughs using Right Side Curl with Reaccumulation.
Here are 3 benefits that come to mind:
1. Minimize Missed Profit Opportunities
Identifying handle troughs can help you spot a stock that may be getting ready to break out of a base.
For breakout buyers, this may help you set an alert or just make you more aware of a stock that's showing positive price action in a key alert zone.
2. Helps Diversify Entry Strategies
A base breakout is one common way to enter stocks.
Identifying handle troughs gives you another option to consider before a base breakout.
This may be helpful for institutional investors who can't make their first decision on a breakout or for investors who prefer retracements over breakouts.
Handle troughs won't always work and you should definitely use a stop loss to protect your downside risk, but it's another way to identify potential reversal points in stocks.
3. Builds a Profit Cushion to Withstand Shakeouts
It's better when there's a move higher that provides some cushion to a recent position, but some base breakouts can test your patience/discipline.
Starting a partial/initial position at a handle trough, may help build up a buffer if price moves through the base's pivot point.
Now - this assumes that price doesn't stop you out of your handle trough entry first, which is always a possibility.
In my Schlumberger (SLB) example, a base breakout entry would've been stopped out using a 6 to 8% stop loss (see chart 1, page 3).
In contrast, a handle trough entry would have kept you in the stock and in position to capitalize on SLB's 245% run towards its 2007 top.
SLB's advance was not an easy one to stay in because it didn't go straight up like many investors expect, but it also never showed any technical signs of breaking down.
SLB made a series of higher lows before it got going to the upside (see chart 1, page 3).
When a stock fails to meet our expectations, many investors (including myself) have a tendency to bail on a stock idea in search of the next great stock.
This often backfires and that's why it's always a good idea to understand the fundamental story behind a stock.
The more you know about a stock, the more likely you are to stick to your plan/rules unless it hits your stop.
Ways to Increase Confidence in Potential Handle Troughs within Bases
Base entries can create a lot of uncertainty.
Will the stock ever break out or will it breakdown and hit your stop?
There are many ways that you can increase your confidence in potential handle troughs.
Here are some important technical factors that you may want to consider:
1. Wait for the Handle Trough to Coincide with Confluence (40 Week EMA)
During uptrends, stocks may find support at their 40 Week EMA.
If you combine Right Side Curl with Reaccumulation and support from the 40 Week EMA, you have just added confluence within a key price zone.
For those who use mathematical ratios, you could also add in a Fibonacci retracement on top of support from the 40 Week EMA.
Did you notice that my SLB example had its handle trough firmly grounded within a price thrust (right-hand side of base), support from the 40 Week EMA and a 0.618 Fibonacci retracement level (see chart 1, page 3)?
The more confluence on a chart, the better evidence you have for a potential reversal to the upside.
2. Look for Strength in Peer Stocks
When you witness a reaccumulation week after a handle has formed, where do other group members stand technically?
Did they already break out or are they setting up in bases at the same time as your stock of interest?
Stocks within the same group tend to move together.
If you have confirmed base breakouts by other group members, your stock may getting ready to break out.
When SLB confirmed its reaccumulation week in 2004, there were other Oil & Gas stocks that had already broke out and some that were setting up in bases like SLB.
In late 2004, Diamond Offshore Drilling (DO) and TransOcean (RIG) were two Oil & Gas stocks that mimicked SLB's bullish base pattern.
They both broke out of bases on the same week (09/03/04), which was 3 weeks before SLB broke out (see charts 1-3, pp. 3-5).
DO went up 1,175% and RIG tacked on 435% before topping in 2007 and 2008, respectively.
Do you think that information is important?
I wrote more about combining Group Leadership and Right Side Curl with Reaccumulation here.
How to Find Potential Handle Troughs within Bases
Note: This article is meant to help you learn from the market and does not serve as investment advice for any specific group or individual. For more information, please read the HSR Terms of Use.
3. Look for Potential Handle Troughs Early in a Market Uptrend
Market uptrends will typically have 2-4 corrections before a bear market sets up.
If you look for potential handle troughs early on within an uptrend, it may be better because you'll have more early-stage bases than late-stage bases.
In my opinion, there's little reason to get into a stock early after it already had a big move and has formed 3 or more bases.
After a stock has been discovered by Wall Street, it's possible that it may gap down while in its base.
This tends to happen in weak market environment and/or late in a market uptrend.
Looking at the other side, the first correction of a market uptrend is typically a temporary move lower that eventually leads to higher prices.
Why may this be true?
From a psychological standpoint, the first correction after a bear market often recalls bad memories for most investors.
After an uptrend starts, the first sign of trouble can quickly trip many investors back into a bearish mindset.
You might hear some investors say, "Here we go again" or "I knew this rally was a trap".
Because this may be the case, the first move back down towards the market low may be viewed as a contrary indicator.
Most people will probably be bearish, so you may want to be bullish.
In addition to common behaviors of price, you may also want to look at individual stocks to see which groups are setting up in bases while the market is pulling back.
This may give you more confidence that you're not just guessing that a low will be made during the correction.
If stocks are forming bases and starting to break out, you will have more evidence to help you make a more informed decision that's based on the market's price action (facts).
4. Find Potential Handle Troughs during Index Undercuts
Have you ever noticed that when a stock market undercuts a prior low, it tends to bounce for several weeks or more?
Sometimes it even puts in a long-term bottom on the undercut.
This happens mostly in bull markets, but it can also take place in bear markets.
When an index undercut (or rally after an undercut) occurs at the same time as a Right Side Curl with Reaccumulation, it may provide a stimulus to price that causes a stock to break out.
How so?
As a market undercuts a prior low, it may have the following human dynamics working in its favor to help drive prices higher:
- Short trades are covered as new lows are printed or at the first sign of a reversal higher.
- Short trades are initiated by bears who believe the market is breaking down.
- Short trades are initiated by bears on rallies into resistance.
- Scared investors sell out because the market made a new low.
Do you see what's happening?
There's not many people left to sell, but there are people who are buying or who'll have to buy if price doesn't meet their bearish expectations.
I have some historical examples of index undercuts that occur in tandem with Right Side Curl with Reaccumulation.
In my SLB example, the market (S&P 500) undercut its May 2004 low in early August, which was two weeks before SLB's Right Side Curl with Reaccumulation was confirmed.
The market then rallied back inside May's undercut level in late August 2004.
While this was happening, SLB confirmed a reaccumulation week AND traded above its high (see chart 1, page 3).
The result?
The market's upside reversal helped SLB rally 13% and break out of its base.
In summary, finding a potential handle trough within a base isn't a better alternative to a base breakout.
Instead, it's a potential option to consider before a breakout (using some of the factors outlined).
Sometimes a handle trough entry isn't stopped out, but a base breakout is and sometimes a handle trough entry offers opportunity earlier than a successful base breakout.
In the market, there are no guarantees in any set up.
Finding a potential handle trough and aligning it with confluence, gives you another idea to consider before a stock breaks out of a base.
Please >>CLICK HERE<< for a PDF of charts 1-3.