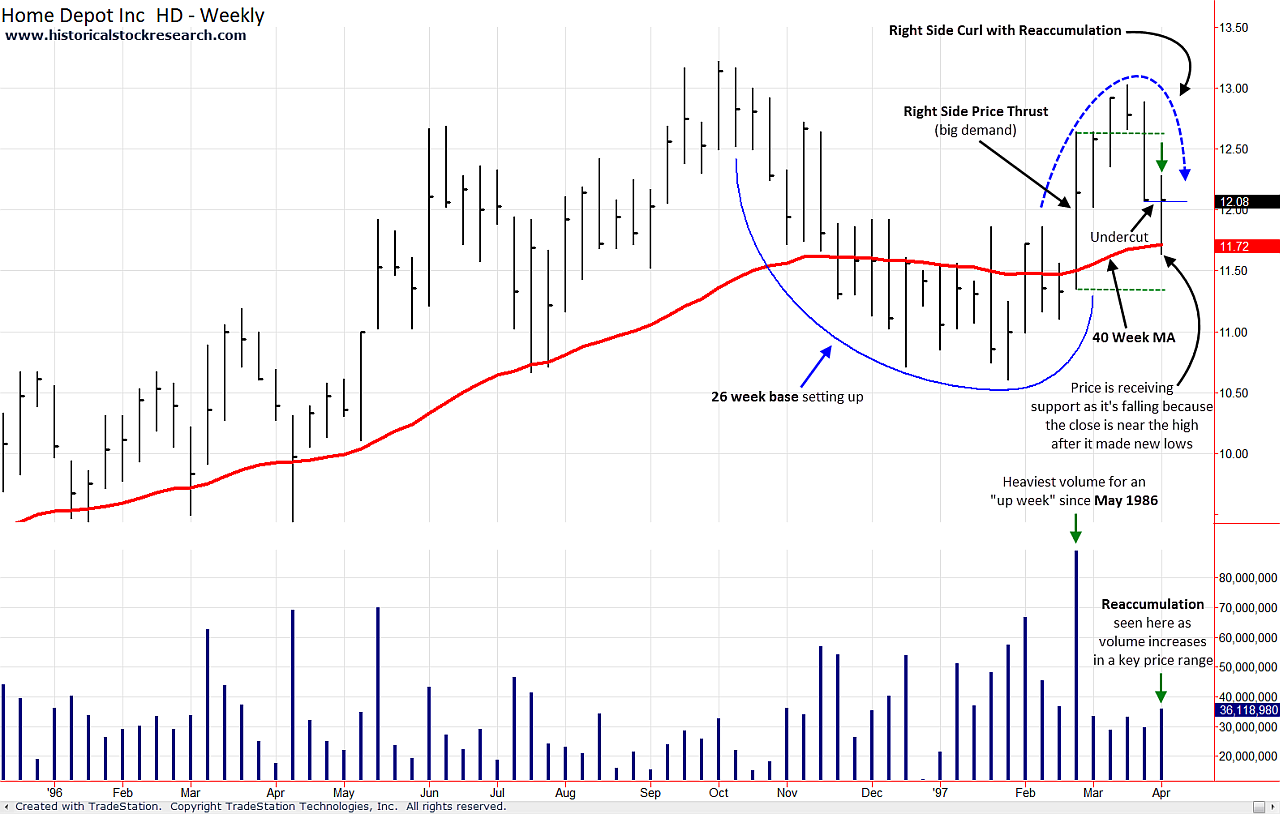
Right Side Curl with Reaccumulation
Note: The historical stock examples given below are for EDUCATIONAL USE ONLY. They ARE NOT to be used to make buy/sell decisions in today's market. For more information, please read the HSR Terms of Use.
Description
After rallying up the right side of its base, price begins to correct (curl), but finds support when it reaches a former price range that featured heavy accumulation.
Behavior Notes:
- During the curl phase, price may find support at a thrusting price bar that's located near the right-hand side of the base. This price action is identical to the Retracement to Prior Demand Week (PDW) behavior discussed earlier except that it occurs on the right-hand side of the base.
- As price corrects or curls, it must undercut the prior week's low before confirming reaccumulation. This shows that price is getting support as it's falling deeper into a Prior Demand Week (PDW).
- Support during the curl phase may also coincide with an important moving average such as the 40 Week Moving Average (MA).
- A move out of the base may occur when price trades above the high of the reaccumulation week AND makes a higher low before price makes a new low.
What you need to know
Right Side Curls with Reaccumulation may lead to a handle trough before a base breakout.
Historical Stock Chart Examples 1A & 1B: Home Depot (HD) 1997
|

Click to enlarge 1A
|

Click to enlarge 1B
|
Please >>CLICK HERE<< to go to the next price behavior within Base Behaviors.
|