Step 2: Improve Attention to Detail (Price Reversal Tops)
by Erik Grywalski
Note: The historical stock examples given below are for EDUCATIONAL USE ONLY. They ARE NOT to be used to make buy/sell decisions in today's market. For more information, please read the HSR Terms of Use.
Price reversals are a sign of selling into strength, but when they occur on record volume and/or wide range they can cause a stock to reverse trend.
Record volume is a week where trading volume is the heaviest of the uptrend or the highest in a stock's history.
Over the years, Wide Range Price Reversals (WRPR) have signaled tops in many stocks.
Price will often fail when it tries to surpass a Wide Range Price Reversal bar.
Here are five (5) topping scenarios that may unfold following a WRPR in a stock:
1. Long-term Topping Process
Price forms a base over many months that fails as it attempts to break out above the price reversal bar.
Historical Stock Chart Example: Taser (TASR) 2005
|

Click to enlarge
|
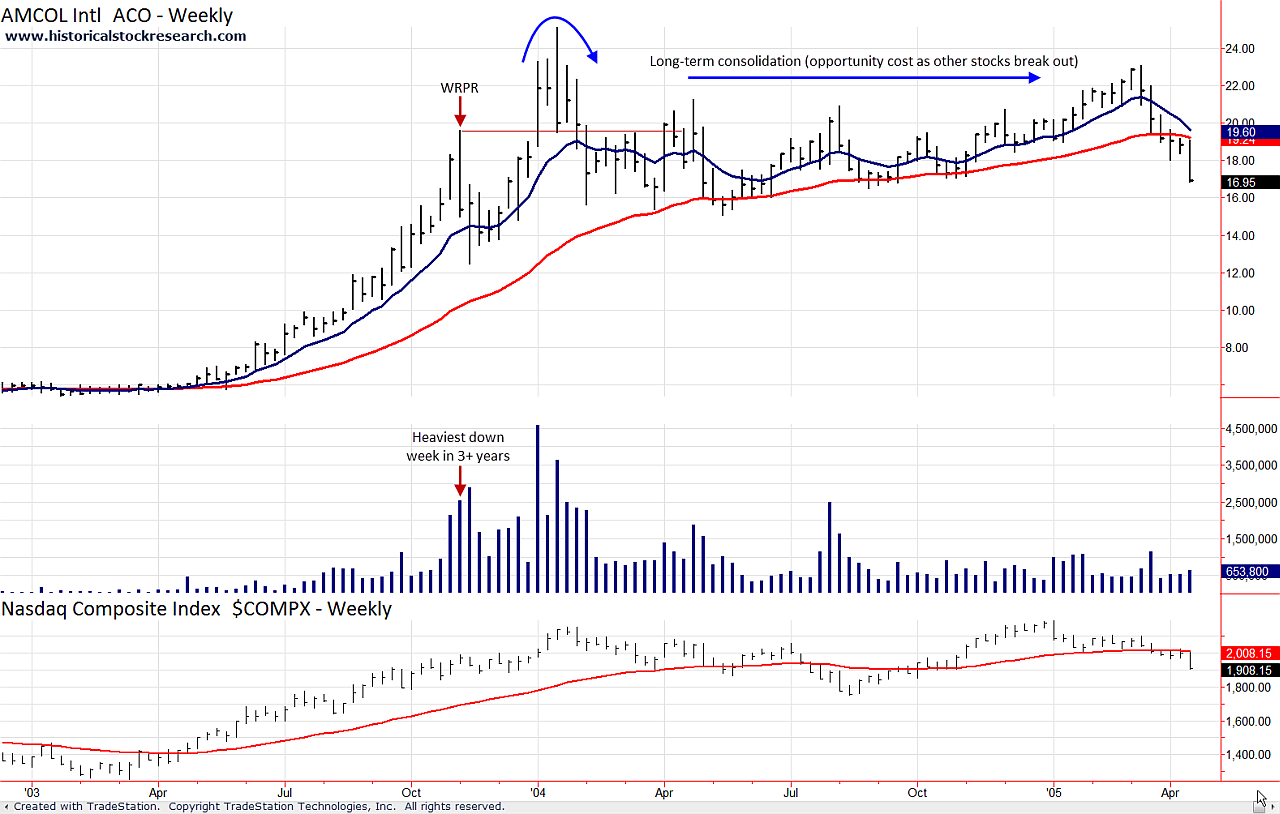
2. Breakout, Rally and Fail
Price breaks out above the price reversal bar and rallies 10-50% before breaking down.
Historical Stock Chart Example: Amcol (ACO) 2004
|

Click to enlarge
|
3. Higher-high and Fail
Price just exceeds the high of price reversal bar within 1-3 months before moving lower.
Historical Stock Chart Example: Canadian Solar (CSIQ) 2008
|

Click to enlarge
|
4. Lower-high and Fail
Price retests the price reversal bar, but can't top its high before moving lower.
Historical Stock Chart Example: Amtech Systems (ASYS) 2011
|

Click to enlarge
|
5. Implosion or Bleed Lower
Price never retests the price reversal bar and moves lower.
Historical Stock Chart Example: Nordstrom (JWN) 1987
|

Click to enlarge
|
Note: In all scenarios, after failing to stay above the reversal bar, price may also trade sideways for months/years without completely breaking down.
Please >>CLICK HERE<< to go to Price Stall Tops.
|