Step 2: Improve Attention to Detail (Base Failure Tops)
by Erik Grywalski
Note: The historical stock examples given below are for EDUCATIONAL USE ONLY. They ARE NOT to be used to make buy/sell decisions in today's market. For more information, please read the HSR Terms of Use.
Base Failures can sink a stock that's been trending higher and are an important topping behavior to identify.
There are two (2) types of base failure tops:
- Base Breakdowns
- Failed Base Breakouts
Please keep in mind, sometimes a base will breakdown and set up again later.
This is bound to happen, but I'm going to describe Base Failures that lead to major tops in stocks.
Base Breakdowns
A base breakdown occurs when a base (or consolidation) fails before it's able to breakout and assert its leadership.
Why is a base breakdown important to identify?
A base is a precursor of market leadership.
Most durable market uptrends require a steady diet of base breakouts to sustain a meaningful advance.
If a base breaks down, it reduces the pool of leadership that's waiting in the wings to fuel a developing advance or reinforce an existing one.
Base breakdowns can be a symptom of a topping market.
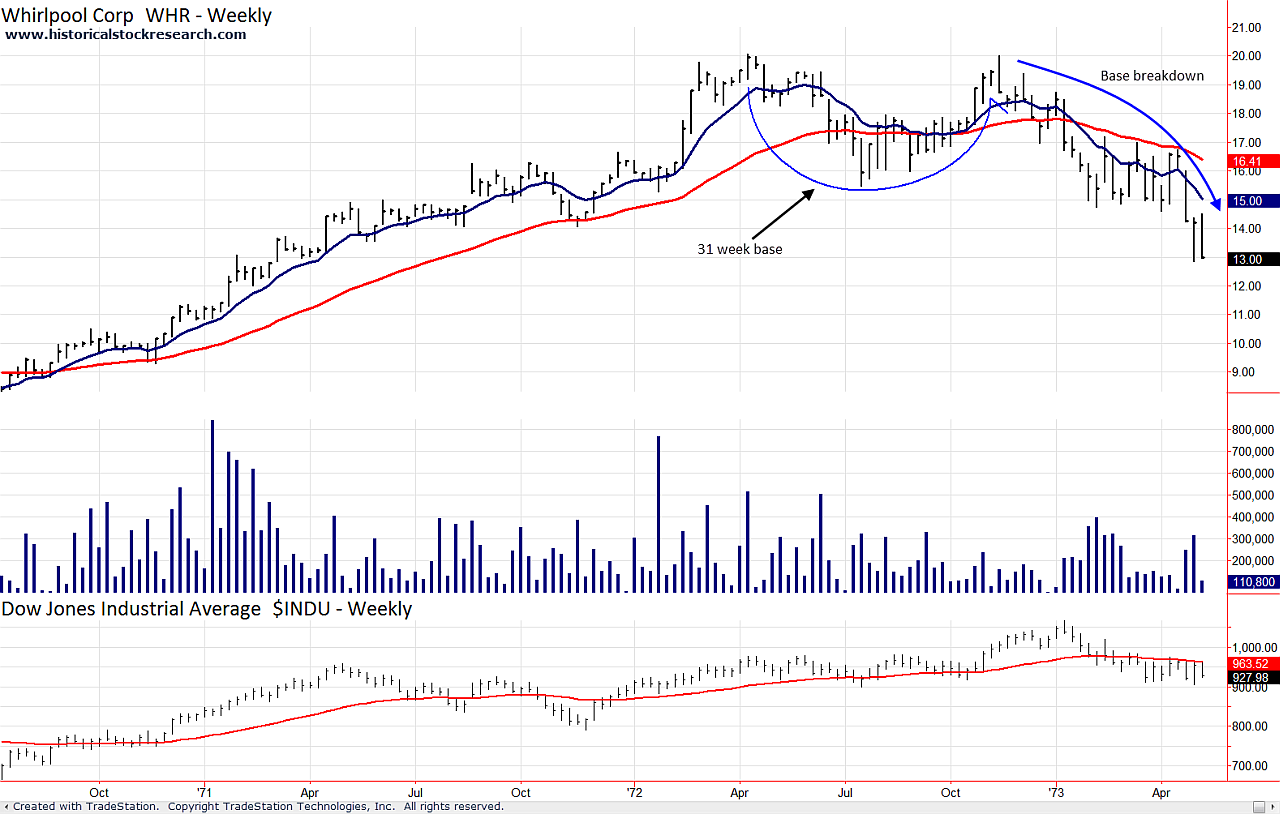
As an example, the '73-'74 Bear Market was preceded by many stocks breaking down from their basing structures.
Historical Stock Chart Example: Whirlpool (WHR) Base Breakdown before '73-'74 Bear Market
|

Click to enlarge
|
Whirlpool fell 73% by 1974.
Failed Base Breakouts
A failed base breakout takes place when a stock breaks out of a base and then rolls over into a decline.
This is negative because new leadership (base breakout) is not working.
When a breakout fails, it tends to put downward pressure on a stock because some investors are forced to sell the stock.
However, there may be some recent investors who hold on hoping that the stock will bounce back.
If the stock finally does rally, it may fail again near the original breakout level or buy point.
This may be caused by the recent investors who decide to sell in order to get out at a break-even price.
After price fails again at the original buy or pivot point, a stock's decline can accelerate lower as more investors realize that the stock's in trouble.
Historical Stock Chart Example: Lam Research (LRCX) 2007 Failed Base Breakout
|

Click to enlarge
|
Lam Research fell 73% by 2008.
The Lam Research example above is just one way that a base breakout can unravel.
Another variation that I've seen repeat many times plays out in four (4) steps:
Step 1: Extended Advance
A stock has a multi-year advance where price rarely closes below its 40 Week MA.
Step 2: Base Breakout Failure
The stock breaks out of a base and fails.
Step 3: Close Below 40 Week MA
Price closes below the 40 Week MA following a failed breakout.
Step 4: Price Rolls Over
Price declines and the stock's advance is over.
Note: The close below the 40 Week MA (Step 3) may be the first close below the 40 Week MA in many years.
Please >>CLICK HERE<< to go to Monthly Chart Tops.
|