Step 2: Improve Attention to Detail (Bearish Butterfly Tops)
by Erik Grywalski
Note: The historical stock examples given below are for EDUCATIONAL USE ONLY. They ARE NOT to be used to make buy/sell decisions in today's market. For more information, please read the HSR Terms of Use.
The Bearish Butterfly is a topping pattern that resembles the shape of a butterfly's outstretched wings.
I know it sounds odd, but I've found that it's a good pattern for finding major tops in stocks.
I'm going to quickly summarize the basics here so you will understand it and be able to identify stocks setting up in Bearish Butterfly topping patterns in the future.
For more specifics on the pattern, you may want to do a Google search if it interests you.
Here are the basics of the Bearish Butterfly pattern:
- Extension pattern - The Bearish Butterfly is an extension pattern, which means it may set up after price exceeds a prior high.
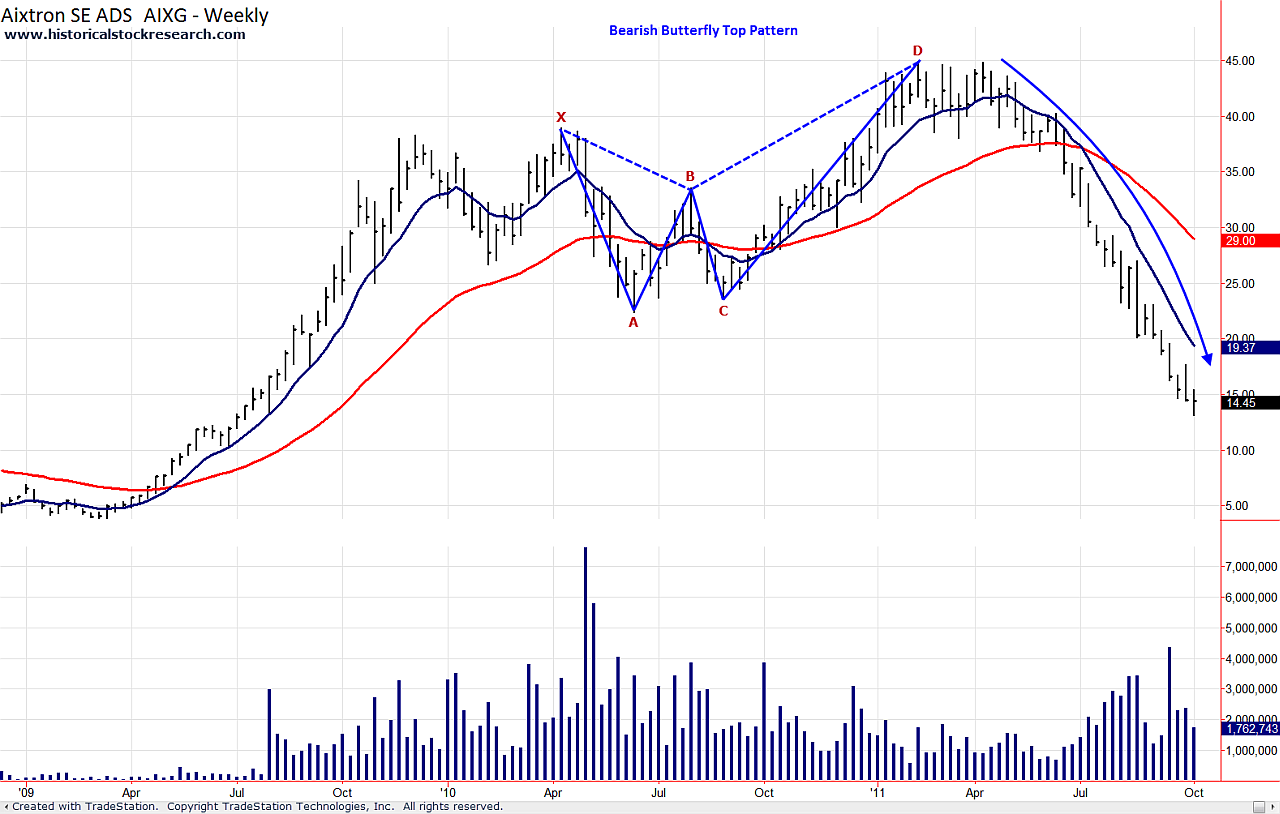
- 5 points - There are 5 points to identify within the pattern and they're labeled X, A, B, C and D. This includes 3 highs (X, B and D) and 2 lows (A&C)
- Fibonacci Levels - Price may reverse and rollover after hitting the 1.272 or 1.618 Fibonacci extension level of the X to A swing.
- Rules - Price cannot exceed Point A, but it must exceed Point X.
Are you confused?
Please take a look at my charts below:
Historical Stock Chart Examples 1A & 1B: Aixtron (AIXG) 2010-2011
|

Click to enlarge 1A
|

Click to enlarge 1B
|
Please >>CLICK HERE<< to go to Base Failures.
|