How to Find Potential Handle Troughs within Bases
by Erik Grywalski
 
Note: The following article is meant to help you learn from the market and does not serve as investment advice for any specific group or individual. For more information, please read the HSR Terms of Use.
One of my goals with this site is to highlight different examples of price troughs within a basing phase using historical market analysis.
This will help you learn from price behaviors that set up before a base breakout.
With this in mind, I'm going to share one example with you right now.
This particular approach, which identifies potential troughs within a handle, is based on two common behaviors of stocks:
- Price Thrust
- Price Retracement
In order for you to learn how these two price behaviors fit together within a base, you must first understand the following statement about how stocks behave:
"Stocks rally (thrust) higher on expanding range/volume and then price may return to the original thrusting zone and bottom."
Where did I get this statement?
I put it together based on my studies of stock price behaviors.
You can read more about it in the Retracement to Prior Demand Week (PDW) behavior found here.
Like anything in the market, a Retracement to a PDW doesn't always catch a low, but it's a common behavior of price.
It can also be applied to different areas on a chart.
In this case, I'm going to apply it to the right-hand side of a base.
When dealing with the right-hand side of a base, I prefer to label a Retracement to Prior Demand Week (PDW) as a Right Side Curl with Reaccumulation.
There are 6 steps required to find potential handle troughs within bases using the Right Side Curl with Reaccumulation price behavior.
I know that sounds like a lot of steps, but I broke it up that way to make it easier for you to understand.
Less steps may leave you too confused.
Here are the 6 steps that may help you identify potential handle troughs using Right Side Curl with Reaccumulation:
Step 1: Confirm that you're in a market uptrend and not in a bear market.
Note: It's okay if you're in a correction within a market uptrend.
Step 2: Using a weekly chart, find a stock that's basing AND showing thrusting behavior coming off a low or as it's scaling the right-hand side of its base.
Note: A price thrust implies that there's competition for a stock. To find one, look for a week that shows both price range expansion and heavy volume.
Step 3: Wait for price to complete the right-hand side of its base and show signs it's running into resistance.
Note: Price may run into resistance close to its former high, but it can sometimes occur 10-20% below a high.
Step 4: Look for price to correct towards the price thrust identified in Step 2.
Note: Price should move downward from its high to form a handle on the base.
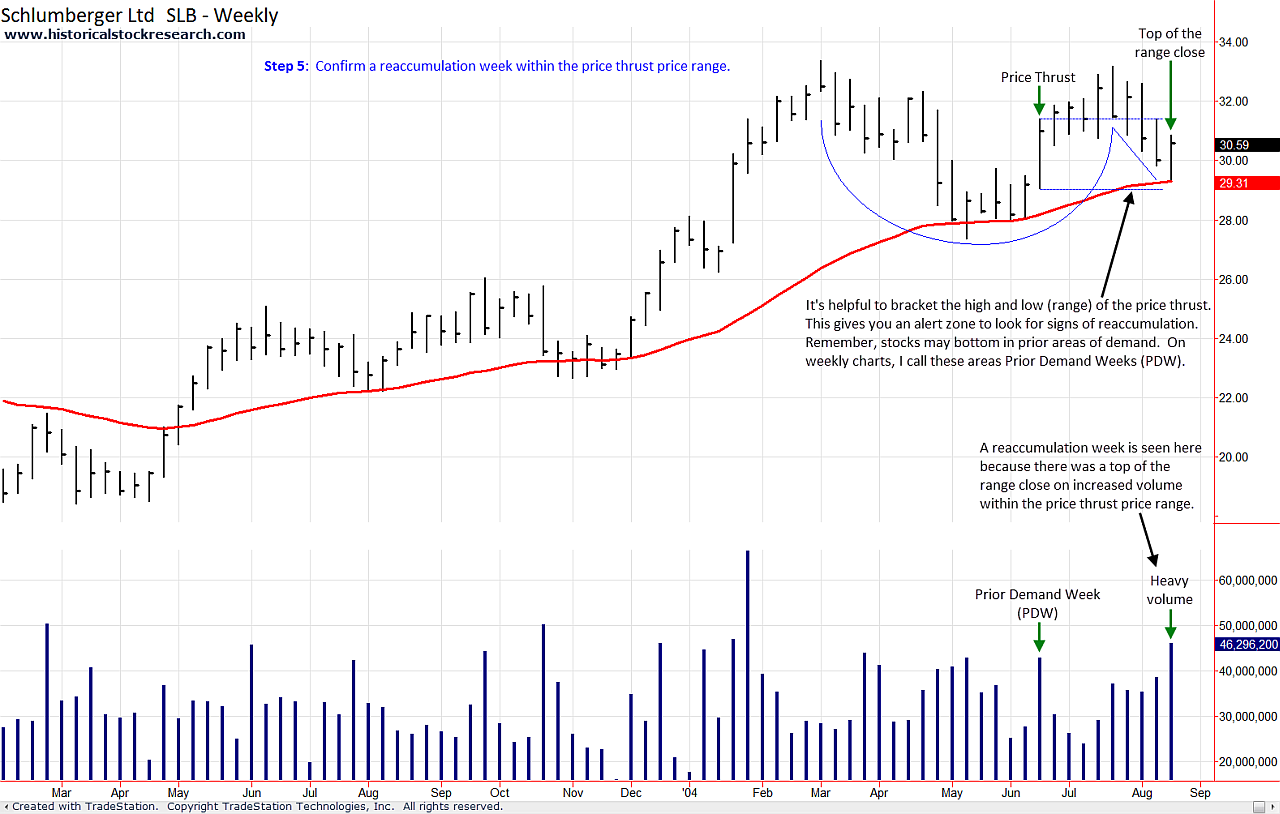
Step 5: Confirm a reaccumulation week within the price thrust price range.
To confirm reaccumulation, price must first make a new low, reverse and close at the mid-point or higher of the week's range on increased volume (from prior week). This price action should occur within the price thrust range from Step 2.
Note: In some cases, it may be helpful to bracket the high and low of the price thrust from Step 2. This will give you an alert zone to look for signs of reaccumulation.
Step 6: After confirming reaccumulation AND making a higher low in the subsequent weeks (before a new low is made), look for price to trade above the high of the reaccumulation week and begin to work its way out of the base.
Note: If the stock does trade above the high price of the reaccumulation week AND has registered a higher low, its formed a potential handle trough. Many times, you'll see several reaccumulation weeks as price corrects, however, if price doesn't trade above the high of the reaccumulation week (or makes a new low) then it's not a handle trough.
Here's the chart sequence for Steps 1-6:
Historical Stock Chart Examples (Steps 1-6): Schlumberger (SLB) 2004
|

Click for Step 1
|

Click for Step 2
|

Click for Step 3
|
|

Click for Step 4
|

Click for Step 5
|

Click for Step 6
|
Note: From this point forward, all charts supporting this article can be downloaded using the provided link that's located at the end of the last page.
Next >>
|