|
How to Improve Attention to Detail During Market Corrections
Note: This article is meant to help you learn from the market and does not serve as investment advice for any specific group or individual. For more information, please read the HSR Terms of Use.
A lot of what happens to a stock depends on the market environment.
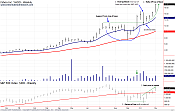
What does the stock do after it breaks out (go higher or fail)?
Is there follow-through in the subsequent weeks (see chart 4A)?
Follow-through (an additional accumulation week that quickly occurs after a high-volume breakout week) is nice to see, but it isn't required for a stock to be successful.
Are there other group members coming up the right-hand side of their bases (Category 1) and getting ready to break out with your stock in a group leadership role (see chart 4B)?
In addition, if a stock pulls back after a breakout, it will usually hold its 10 Week EMA and move higher (see chart 4A).
Does this take place?
As you can see, there are many details that you need to keep track of, but I didn't say that this was an easy process.
The goal is to improve your attention to detail by keeping track of important market facts.
With this exercise, you'll be focused on the market and will not require much help to determine what the market is doing because you're looking at unbiased facts (the market).
However, you will only improve your attention to detail if you are able do the work and put in the time.
Historical Stock Chart Examples 4A & 4B: Nike (NKE) and Wolverine Worldwide (WWW) '94-'95
|

Click to enlarge 4A
|

Click to enlarge 4B
|
I've also studied stocks that break out during a market rally off a low (see chart 5A) and avoid failure when the market eventually hits new lows (or pulls back) in a correction.
This is positive because the stock is resisting the market's decline.
The stock may even pull back on top of its most recent base when the market hits new correction lows (see chart 5B).
This is important to recognize because it shows that some underlying stocks are showing strength while the market is making new lows.
Historical Stock Chart Examples 5A & 5B: Yahoo (YHOO) Breaks Out and Holds During '98 Retest
|

Click to enlarge 5A
|
Click to enlarge 5B
|
Historical Fact on the Importance of Base Breakouts:
The 1982 Bull Market began in late August 1982. However, retail stocks were breaking out of bases and rallying as the general market continued to print new lows months before its early August '82 bottom. This was an important clue to identify because retail stocks tend to lead at the beginning of an economic expansion.
Category 3 - Stocks Refusing to Base
Category 3 can help you judge the strength of the correction at the time you review the market.
For example, would technology, retail or financial stocks ignore the market (refuse to base) and hit new highs ahead of the market if the correction was really that severe?
Probably not, but keep in mind that things may change.
You should change if the market changes (technically).
I put stocks into this category if they consistently close above the 10 Week EMA during a market correction. This is easily noticed because a stock closes above its 10 Week EMA, but the market can't.
While it's true that a stock can form a base by staying above its 10 Week EMA, it's very common for stocks to establish a base trough well below the 10 Week EMA when the market is correcting.
A base trough can occur at the 40 Week EMA or even below this key moving average, which is not a bearish indicator.
Which groups refuse to base? Are they early cycle groups (tech, retail and financial) or mid to late cycle groups (industrial, materials and energy)?
Stocks that refuse to base cannot only help you evaluate the strength of the correction, they can also help you understand whether or not bases within the same group have potential to break out and move higher (see chart 6A).
If the stocks that refuse to base remain strong, then the basing group members may break out later (see chart 6B).
While there's no guarantee that stocks that refuse to base will remain strong, they can help you identify potential market leadership.
If a stock loses strength and closes below its 10 Week EMA, you can place it in Category 1 (Stocks Basing).
Historical Stock Chart Examples 6A & 6B: RF Micro Devices (RFMD) Tips Off Semis in '99
|

Click to enlarge 6A
|

Click to enlarge 6B
|
<< Previous | Next >>
| 


