|
5 Weekly Warning Signs Before a Stock Breaks its 10 Week MA
Note: This article is meant to help you learn from the market and does not serve as investment advice for any specific group or individual. For more information, please read the HSR Terms of Use.
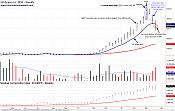
Historical Stock Chart Examples 1A & 1B (First Swing Point High): InfoSpace.com (INSP) 2000
InfoSpace.com was one of the technology stock leaders that garnered a lot of attention during the Nasdaq's parabolic rise into its March 2000 Top.
INSP broke out of a 6-month base in November 1999 and advanced 600% before confirming a First Swing Point High (fSPH) in March 2000 (see chart 1A).
It was InfoSpace's first swing point high since July '99.
That's nearly eight months and an important change of character.
But there was more trouble brewing for the high-flying Internet stock.
The following week, INSP closed below its 10 Week MA for the first time since mid October 1999 (see chart 1A).
The break of the 10 Week MA marked the beginning of the end for InfoSpace.com (see chart 1B).
By 2002, Infospace.com had fallen 99% from its March 2000 high.
As an aside, a month before it topped, Infospace's Founder came out and said that InfoSpace.com would be a bigger company than Microsoft (MSFT).
At the time, InfoSpace.com had total revenues of less than $50 million vs. Microsoft's $20 billion.
InfoSpace.com never became a bigger company than Microsoft and now trades on the market as Blucora (BCOR).
|
Click to enlarge 1A
|

Click to enlarge 1B
|
2. Inside Bar
An inside bar forms when a stock's price range (high and low) is contained within or "inside" the prior week's price range.
It's a common technical signal, but when an inside bar surfaces in an overly extended stock, it can serve as a warning that upward momentum has stalled.
In extended stocks, inside bars will often appear after a stock has gone on a streak of higher highs and higher lows.
This subtle change in a stock's character is a small, but important detail because price failed to make a higher high for the first time in many weeks.
As a result, the inside bar breaks a stock's bullish rhythm, which may lead to a chain of events that causes a stock to drop.
Historical Stock Chart Examples 2A & 2B (Inside Bar): Sina Corporation (SINA) 2011
Sina (SINA) was a stock that broke out during the late 2010 Market Uptrend.
After advancing over 100% in 23 weeks, SINA took off and almost doubled in only 8 weeks.
At the end of this furious sprint, SINA printed an inside bar for the week ending 04/29/11 (see chart 2A).
The inside bar came after seven consecutive higher highs and higher lows.
Although the inside bar closed higher for the week, it was the first week in 9 weeks that price failed to make a higher high.
The following week, SINA made its first lower low in 2 months (see chart 2B).
This hinted that the prior week's inside bar might have kicked off the start of a change in trend.
If that didn't convince you that SINA was vulnerable, the following week's high volume break of the 10 Week MA should've gotten your attention (see chart 2B).
The decline was SINA's heaviest volume week of its entire uptrend, a bearish sign.
The chain of events following the inside bar signal turned out to be significant as SINA topped and rolled over (see chart 2B).
|

Click to enlarge 2A
|

Click to enlarge 2B
|
<< Previous | Next >>
| 


