How to Spot Tops in Stocks Using Weekly Inside Bars
by Erik Grywalski
 
Note: The following article is meant to help you learn from the market and does not serve as investment advice for any specific group or individual. For more information, please read the HSR Terms of Use.
Inside bars are one of the most basic technical signals to identify on a stock chart.
However, despite their simplicity, inside bars can be very good indicators of a potential top in a stock.
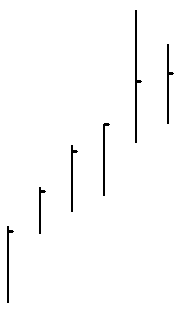
Do you see the price bars to the right?
The last bar on the far right is an inside bar because its price range is contained within or "inside" the price range of the previous price bar.
In my own studies, I've identified a specific sequence of technical events centered around the inside bar that may help you spot tops in stocks.
Before I get into the details of the topping sequence, you should know that not all stocks that top out on inside bar signals will follow this sequence.
It's something that I noticed in my own work and I'm sharing it with you now.
On the next page, I've included five (5) historical stock chart examples that demonstrate this sequence.
Now - I won't take any more of your time.
Here are the four (4) technical events that make up the Inside Bar Topping Sequence:
Event 1: Hard Charge to New Highs
What to look for:
A sudden acceleration of price in an extended stock or a stock that's been trending higher for several years. The move may feature a streak of higher highs and higher lows.
Note: Look for a minimum of 2-3 weeks in the acceleration and wide range bars. Volume may or may not be heavy on the ramp up.
Event 2: Inside Bar
What to look for:
A week where price trades "inside" the previous week's price range. This means that price will have a lower high and a higher low than the preceding week's price bar.
Note: The inside bar gives you a warning that momentum has stalled because price couldn't make a higher high like many of the bars that preceded it.
Event 3: Lower Low
What to look for:
A week that undercuts the inside bar's intraweek low.
Note: The lower low may be the first lower low in many weeks/months, which is another clue that upward momentum is waning.
Event 4: Break and Close Below the 10 Week Exponential Moving Average (EMA) on Heavy Volume
What to look for:
Price breaks and closes below the 10 Week EMA on heavy volume.
Note: In very extended stocks, a break of the 10 Week EMA may not occur until price has come down well off its high. InfoSpace (INSP) is a good example (see next page).
That's all there is to the topping sequence, but I know what you're thinking.
Why not just wait for a close below the 10 Week EMA before getting concerned?
Who cares about all of the other noise that comes before the moving average break?
Those are all valid questions, but in the market, the more prepared and alert you are, the more ready you'll be to act in a decisive manner.
Also, the topping sequence gives you 4 consecutive signs of trouble instead of one (break of key moving average):
- Price acceleration (change of character)
- Inside bar (stalling of momentum)
- Lower low (loss of momentum)
- Break of key moving average (loss of support)
Please take a look at the charts on the next page to see what I mean.
Next >>
|