May 1970
Note: The historical chart examples given below are for EDUCATIONAL USE ONLY. They ARE NOT to be used to make buy/sell decisions in today's market. For more information, please read the HSR Terms of Use.
"Inflation, Recession and a Frantic Bear Market"
That was the headline on the cover of the June 5, 1970 edition of LIFE Magazine.
Ironically, the market bottomed the week before and began an uptrend that lasted until January 1973.
The 1968-1970 Bear Market dished out some of the biggest losses to stock investors since the 1929 Crash.
In many ways, it was much worse than 1929 because more people owned stocks in 1970, which resulted in a higher total paper loss.
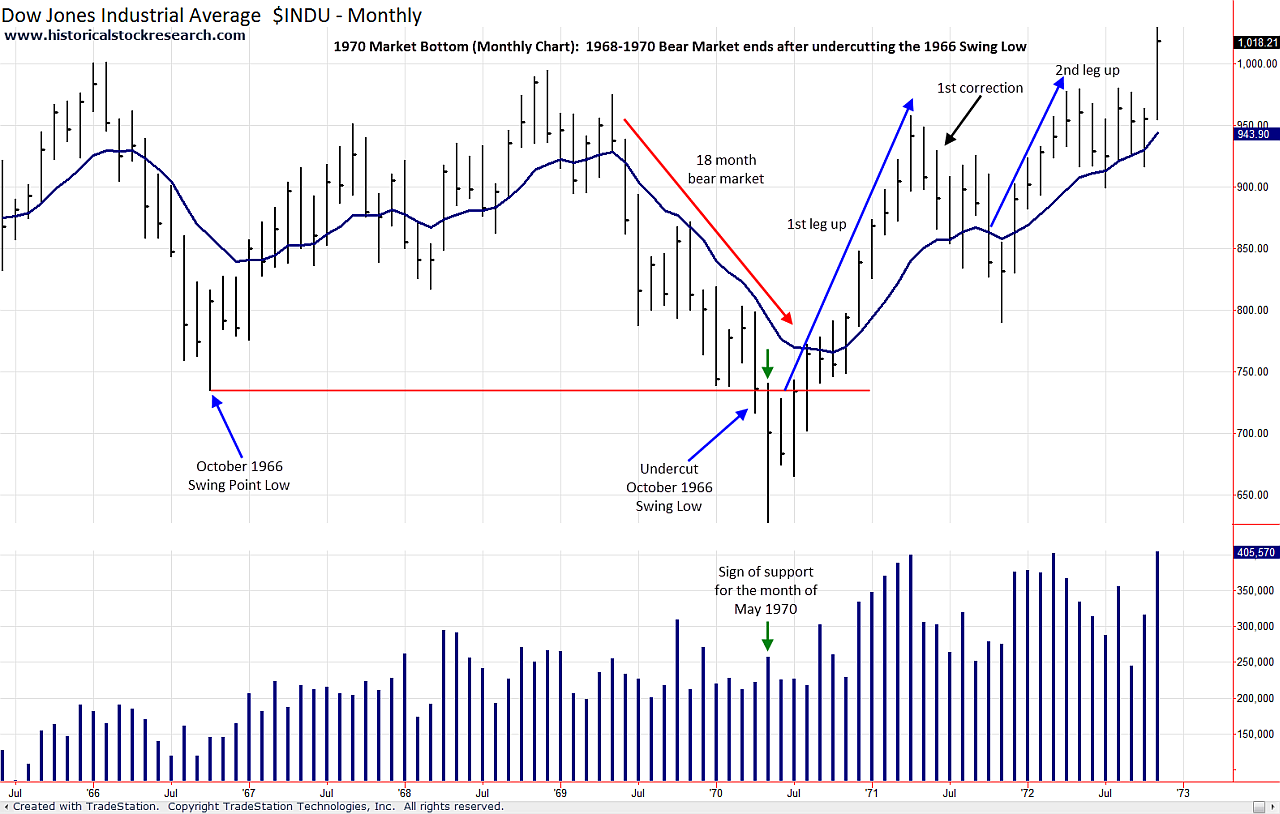
The Dow Jones Industrial Average fell 37% in 18 months, but its last leg down culminated in a precipitous, 7-week drop that sent prices crashing through the October 1966 Swing Point Low.
When the dust settled, the Dow had undercut its October 1966 low by nearly 100 points, which was deep enough to get everyone out of the market and set up a major market bottom.
For individual stocks, the market decline was so severe that some stocks didn't break out of their first bases until 5-6 months after the May 1970 bottom.
Others didn't break out until the latter part of 1971, which was more than 12 months from the May 1970 bottom.
These facts teach us two important lessons about market bottoms:
1. Not all market bottoms begin with loads of base breakouts
After big drops like the '68-'70 decline, there won't be many bases set up to break out at the bottom.
For markets like 1970, it's wise to consider other important events that can cause a market to change its direction and set up bases.
From a technical perspective, the undercut of the October 1966 Swing Point Low was a watershed event that helped turn the market around.
Markets tend to bounce after prior lows are breached and the 1970 reversal demonstrates this important characteristic of markets.
Note: The 1970 Uptrend ended in early 1973 after the Dow took out its February 1966 all-time high.
2. The first leg of an uptrend may set the table for future market leadership
After devastating declines, the first leg of an uptrend helps the majority of stocks get back above their major moving averages (10 and 40 Week MAs).
This repair phase may lead to base formation later on down the road when the market experiences its first correction.
During the 1970-1973 uptrend, the market's first leg up (late-'70 to early-'71) helped drag a lot of stocks back above their major moving averages.
However, it wasn't until the market's first correction (May '71-November '71) ended that some stocks began to break out of their first bases since bottoming in 1970.
1970 Market Bottom: Dow Jones Industrial Monthly and Weekly Charts
|

Click to enlarge
|

Click to enlarge
|
Please click on the links below to see some of the base breakouts from the 1970 Bull Market:
(coming later)
Please >>CLICK HERE<< to go to 1980.
|