October 1999
Note: The historical chart examples given below are for EDUCATIONAL USE ONLY. They ARE NOT to be used to make buy/sell decisions in today's market. For more information, please read the HSR Terms of Use.
The October 1999 Market Bottom in the Nasdaq Composite led to one of the most powerful stock rallies of all time (Nasdaq rallied 95% in 5 months), however, the actual correction low occurred on August 10, 1999.
So what happened between August and October 1999?
After rallying 19% out of its August low, the Nasdaq chopped around for nearly 7 weeks.
During this time, there were many opinions on where the market was headed for the rest of the year.
If you weren't focused on technology stocks, you may have thought that the stock averages were headed for a bear market.
Outside of technology, many stock sectors were already in their own private bear markets.
In fact, some pointed to a slumping advance/decline line, the increasing number of stocks hitting new 52 Week Lows and Y2K worries as reasons why the market was headed for real trouble.
But as you may already know, personal opinions take a backseat to the price action of market averages and its leading stocks.
A majority of the '90s decade had been all about the Nasdaq and it was no different in 1999.
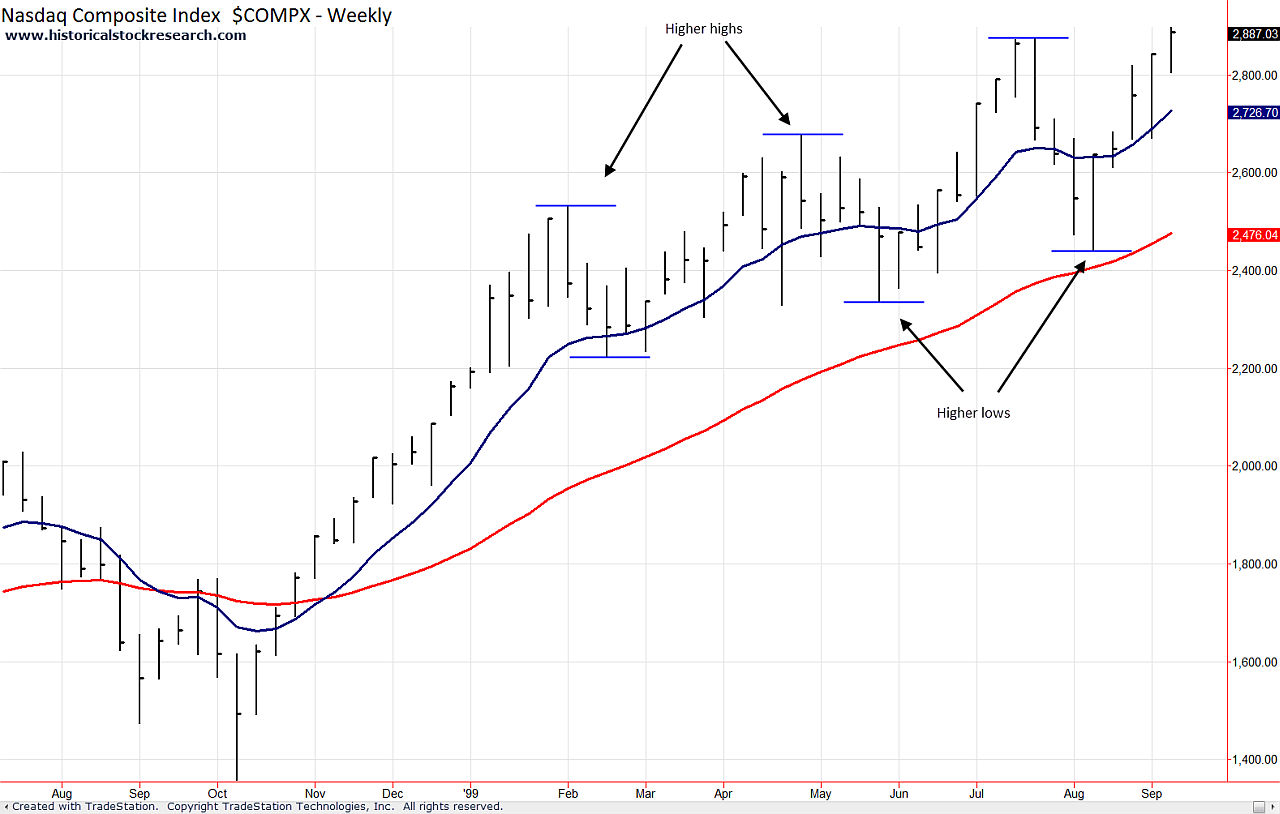
From January to September 1999, the Nasdaq Composite had made a series of higher highs and higher lows, which wasn't price action indicative an approaching bear market.
Historical Index Chart Example: Nasdaq Composite Uptrend (1999)
|

Click to enlarge
|
Additionally, underneath the surface, there were many technology stocks outperforming the market.
Historical Stock Chart Examples: Nasdaq Leaders Outperforming the Broad Economy Index (S&P 500)
|

Click to enlarge
|

Click to enlarge
|

Click to enlarge
|
William O'Neil, famous stock investor and founder of Investor's Business Daily, talked about the limitation of using the Advance/Decline Line as a primary indicator of the market's health.
In his excellent book, How to Make Money in Stocks, Mr. O'Neil commented that advance-decline lines are "imprecise because the advance-decline line sometimes may veer down substantially before the actual top in a bull market. In other words, a market keeps advancing toward higher ground but is being led by fewer stocks."
This statement was very fitting for what was happening during late '90s market environment.
Yes, there was deterioration among many stocks (old economy), but there were still pockets of strength in many technology-related sectors (new economy).
Without a doubt, the market was being led by fewer stocks, but these stocks (technology) were still in good technical shape and deserved respect for their potential.
With that in mind, let's take a look at some of the market leadership that evolved throughout 1999.
There are 5 important groups of base breakouts to review from the 1999 Cycle:
1. Base breakouts during the first six months of 1999.
These stocks ignored the market's choppy trend and were a sign of relative strength underneath the stock averages.
2. Base breakouts off the August 1999 bottom.
Many names that broke out of the August low didn't fail when the market chopped around for 7 weeks, which was a positive indicator.
3. Base breakouts between the weeks ending 09/17/99 and 10/29/99.
Some stocks broke out ahead of the market, another bullish sign.
4. Base breakouts between the weeks ending 10/29/99 and 11/19/99.
These stocks helped fuel the Nasdaq's move to new highs.
5. Base breakouts after the week ending 11/19/99.
After an uptrend begins and the early leaders are extended, reinforcements are needed to help sustain an advance. Stocks that breakout after a rally is underway for at least a month are called Reinforcing Bases.
Please click on the links below to see some of the base breakouts from the 1999 Bull Market:
(coming later)
Please >>CLICK HERE<< to go to 2006.
|