Price Thrust Above Rising 10 Week MA
Note: The historical stock examples given below are for EDUCATIONAL USE ONLY. They ARE NOT to be used to make buy/sell decisions in today's market. For more information, please read the HSR Terms of Use.
Description
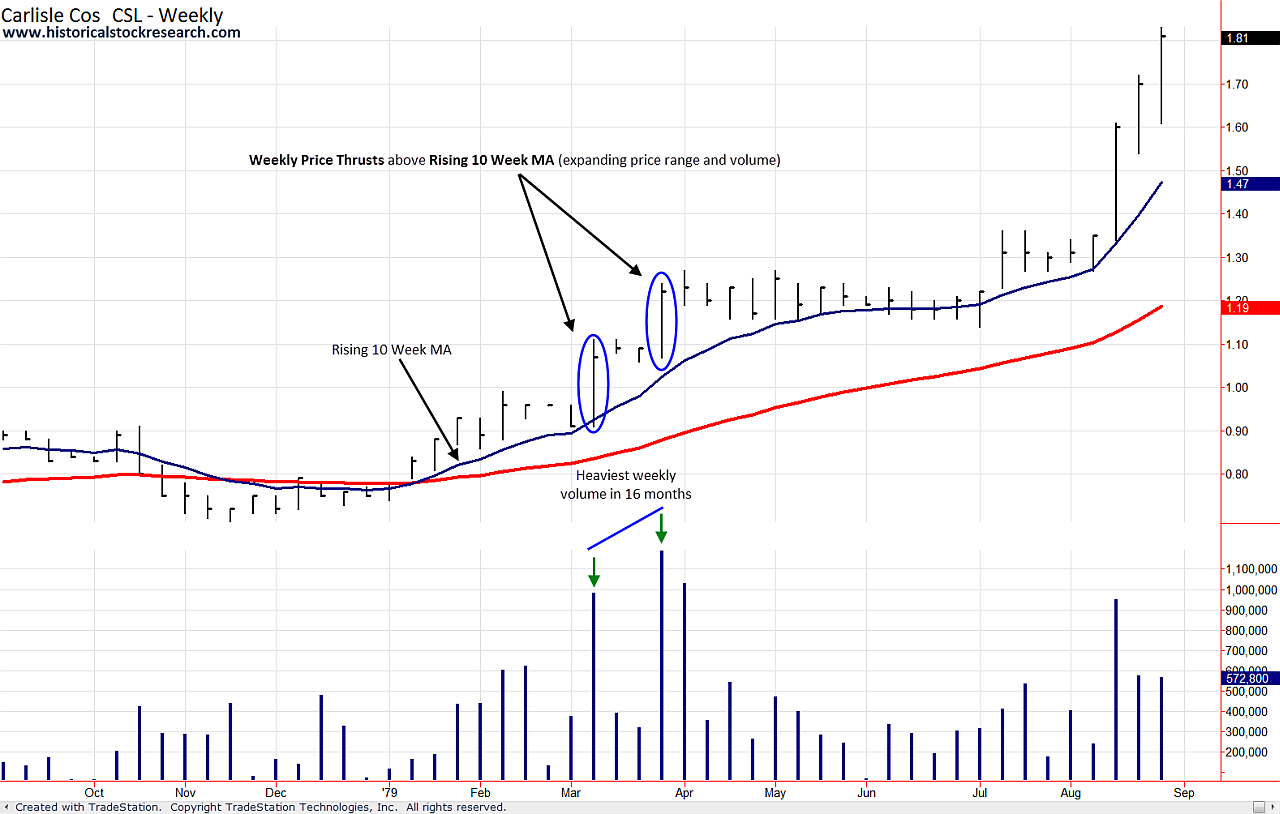
Price range AND volume expand as price rallies above its rising 10 Week Moving Average (MA).
Behavior Note: Price should close in the upper half of its trading range and the weekly volume total may be the heaviest in months/years.
What you need to know
- Price Thrusts Above a Rising 10 Week MA indicate strong interest in a stock and may lead you to emerging investment themes or existing themes that you missed.
- The price range of a price thrust may act as a support/bottoming price zone during future corrections. This may help you anticipate a base's trough and give you an alert zone to look for signs of reaccumulation and/or bottoming price behaviors.
For more details on #2, please click here to review the Retracement to Prior Demand Week (PDW) price behavior found in Step 1 (Base Behaviors).
Historical Stock Chart Examples 1A & 1B: Carlisle Companies (CSL) 1979-1980
|

Click to enlarge 1A
|

Click to enlarge 1B
|
Please >>CLICK HERE<< to go to the next price behavior within Prebase Behaviors.
|