Support on Price Decline
Note: The historical stock examples given below are for EDUCATIONAL USE ONLY. They ARE NOT to be used to make buy/sell decisions in today's market. For more information, please read the HSR Terms of Use.
Description
After undercutting the prior week's low, price rallies to close at the midpoint (or higher) of its range on increased volume.
Behavior Notes:
- Price can finish up or down for the week, but the closing price should at least reach the midpoint of the weekly range.
- Weekly accumulation as price makes lower lows doesn't imply a bottom, but it helps you evaluate the decline from the market's perspective.
What you need to know
When price rallies to close at the midpoint of its range after making new lows, it indicates that institutions are using the weakness to accumulate stock.
This is important because as a stock corrects, it's more common to see distribution as the excesses of the prior advance are unwound.
If there's accumulation on the decline, that's a sign of support and something positive to note about the stock's price action.
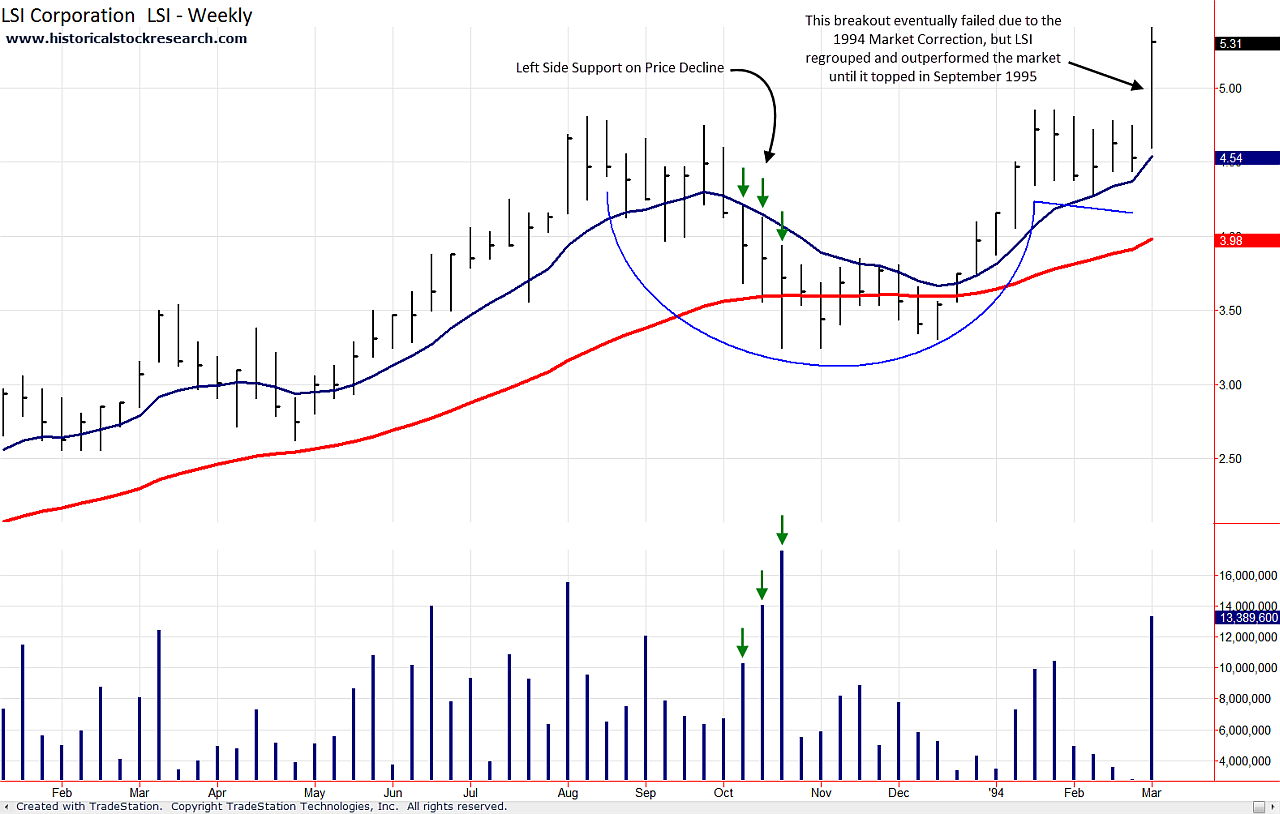
Historical Stock Chart Examples 1A & 1B: LSI Logic (LSI) 1993
|

Click to enlarge 1A
|

Click to enlarge 1B
|
Please >>CLICK HERE<< to go to the next price behavior within Base Behaviors.
|