Undercut of Prior Swing Point Low
Note: The historical stock examples given below are for EDUCATIONAL USE ONLY. They ARE NOT to be used to make buy/sell decisions in today's market. For more information, please read the HSR Terms of Use.
Description
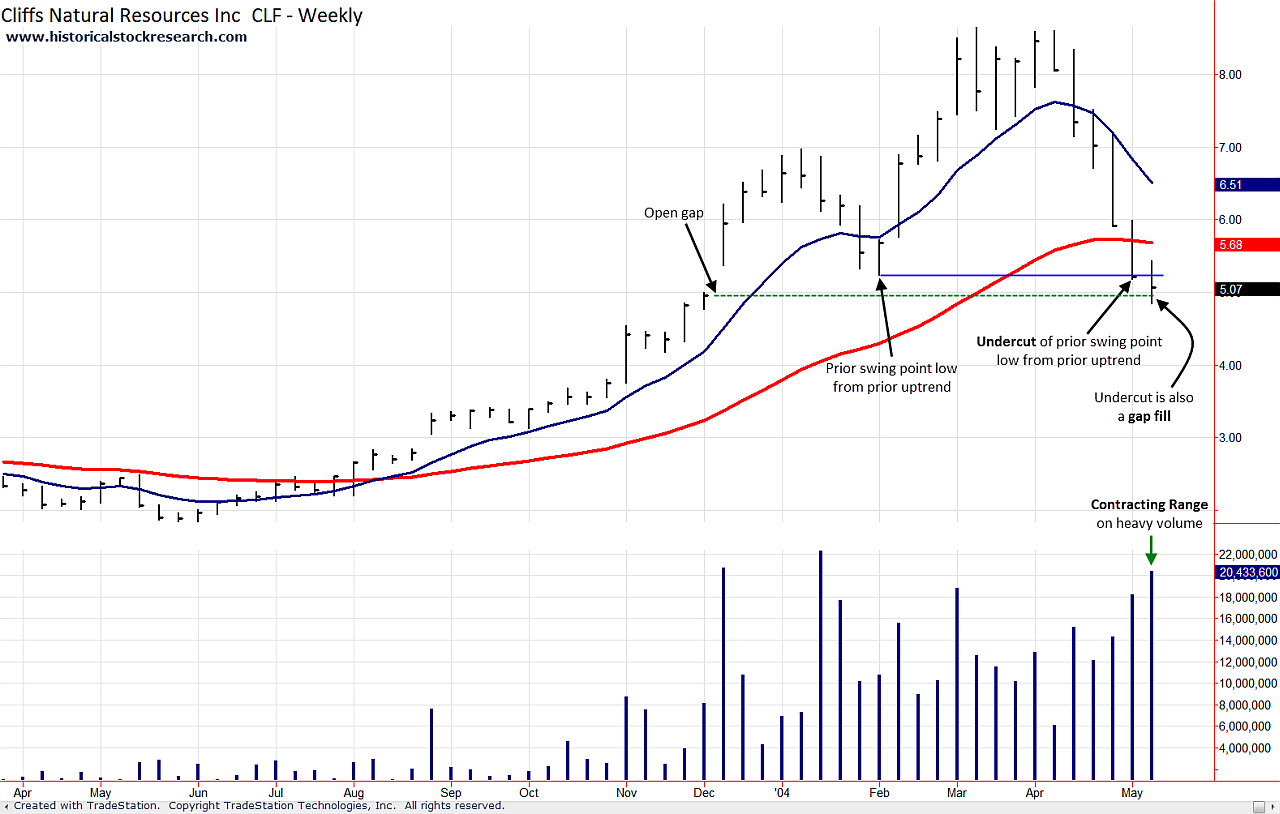
Price undercuts a swing point low from its prior uptrend.
Behavior Note: Other technical factors such as a Retracement to PDW, Gap Fill or Contracting Price Range may coincide with the undercut to increase the probability of a reversal higher.
What you need to know
Price tends to bounce after it undercuts a swing point low and this bounce may turn out to be the bottom for a stock.
Why might this happen?
Investors place protective sell stops under swing point lows.
When price undercuts a swing point low, it forces stockholders to sell and may attract short sellers who believe the stock is breaking down.
Both of these dynamics may cause price to rally because there's less selling pressure after the undercut and anyone who's short must cover (buy back) their short position if the stock's price begins to rise.
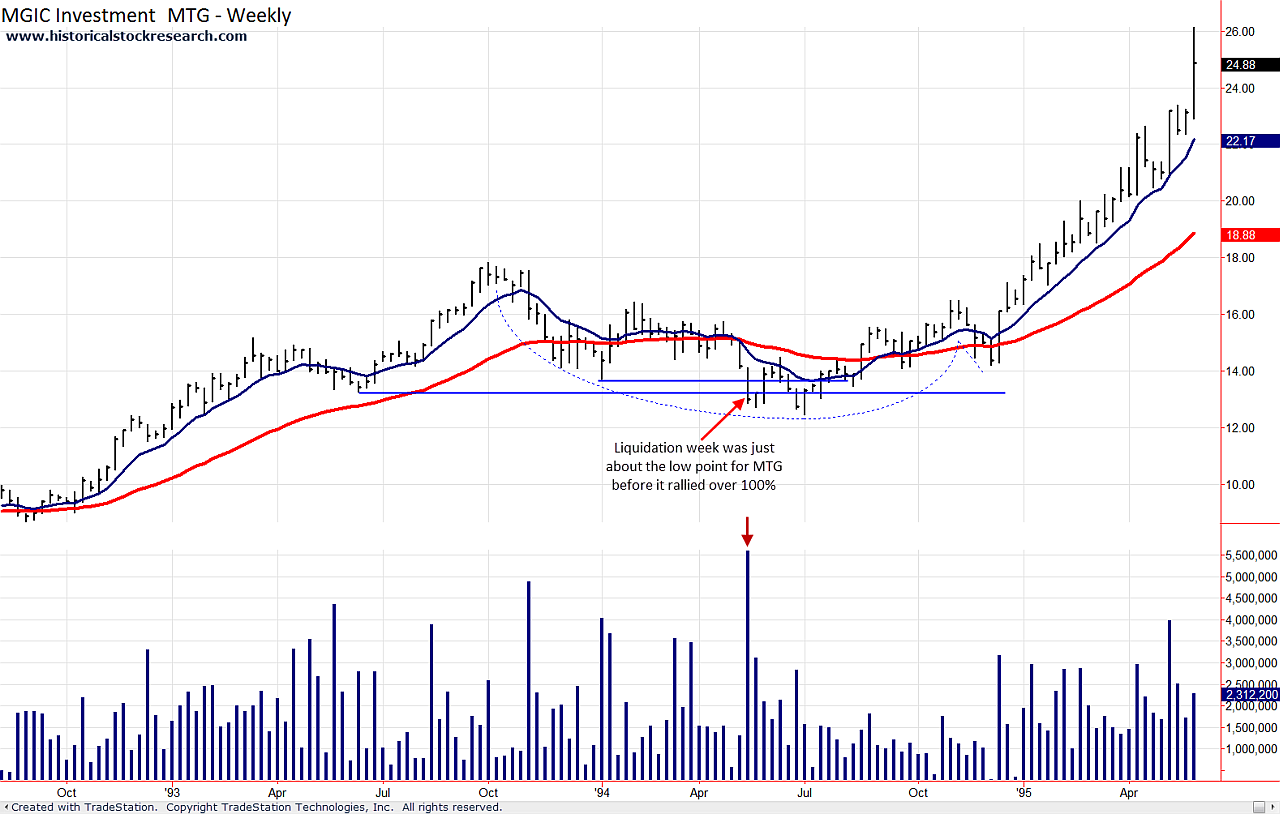
In other instances, an Undercut of a Prior Swing Point Low may produce a heavy volume liquidation where range expands AND price closes near its low for the week.
This bearish action tends to scare out many stockholders, which ironically, helps set the stage for a bottom.
For an example of this behavior, please see chart examples 2A & 2B (below).
Historical Stock Chart Examples 1A & 1B: Cliffs Natural Resources (CLF) 2004
|

Click to enlarge 1A
|

Click to enlarge 1B
|
Historical Stock Chart Examples 2A & 2B: MGIC Investment (MTG) 1994-1995
|

Click to enlarge 2A
|

Click to enlarge 2B
|
Please >>CLICK HERE<< to go to the next price behavior within Base Behaviors.
|