Price Acceleration Above Rising 10 Week MA
Note: The historical stock examples given below are for EDUCATIONAL USE ONLY. They ARE NOT to be used to make buy/sell decisions in today's market. For more information, please read the HSR Terms of Use.
Description
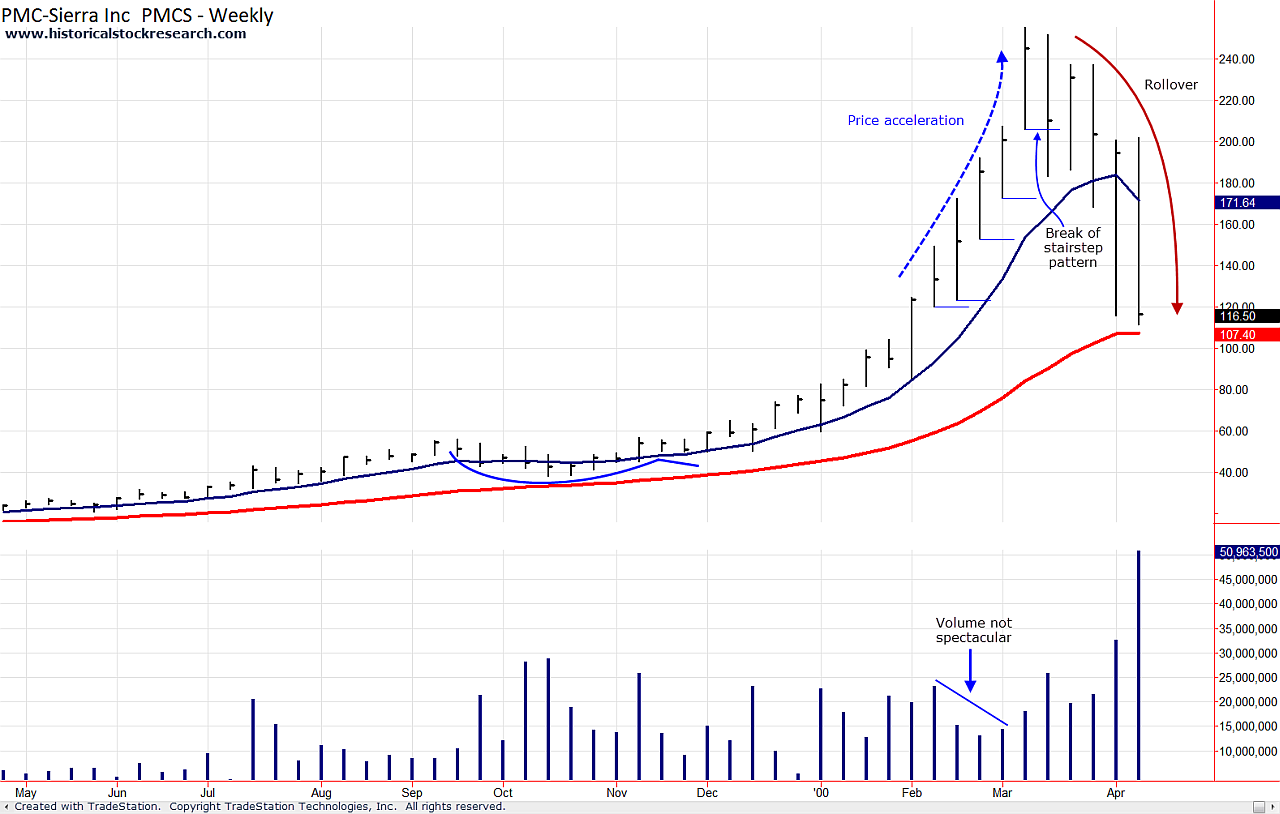
Price rallies for two (2) or more weeks in a manner that shows a distinct steepening of an advance compared to its prior uptrend.
Behavior Notes:
- A price acceleration is a series of weeks that collectively show a change in a stock's rate of advance.
- A buying climax or distribution week may punctuate the peak of a price acceleration.
- An exhaustion gap may occur on the daily chart within one of the price acceleration weeks. If present, the exhaustion gap should appear after an advance.
- Wide range bars are common during a price acceleration. They can show up in a consecutive pattern of higher highs and higher lows. A break of this stairstep pattern may serve as an early warning that the move is ending.
- Volume is not always heavy on a price acceleration.
What you need to know
A Price Acceleration Above a Rising 10 Week MA is a noticeable change in a stock's character, which may lead to a topping out phase.
Historical Stock Chart Examples 1A-1C: PMC-Sierra (PMCS) 2000
|

Click to enlarge 1A
|

Click to enlarge 1B
|

Click to enlarge 1C
|
To learn more about Price Accelerations, please click here.
Please >>CLICK HERE<< to go to the next price behavior within Topping Behaviors.
|