October 1990
Note: The historical chart examples given below are for EDUCATIONAL USE ONLY. They ARE NOT to be used to make buy/sell decisions in today's market. For more information, please read the HSR Terms of Use.
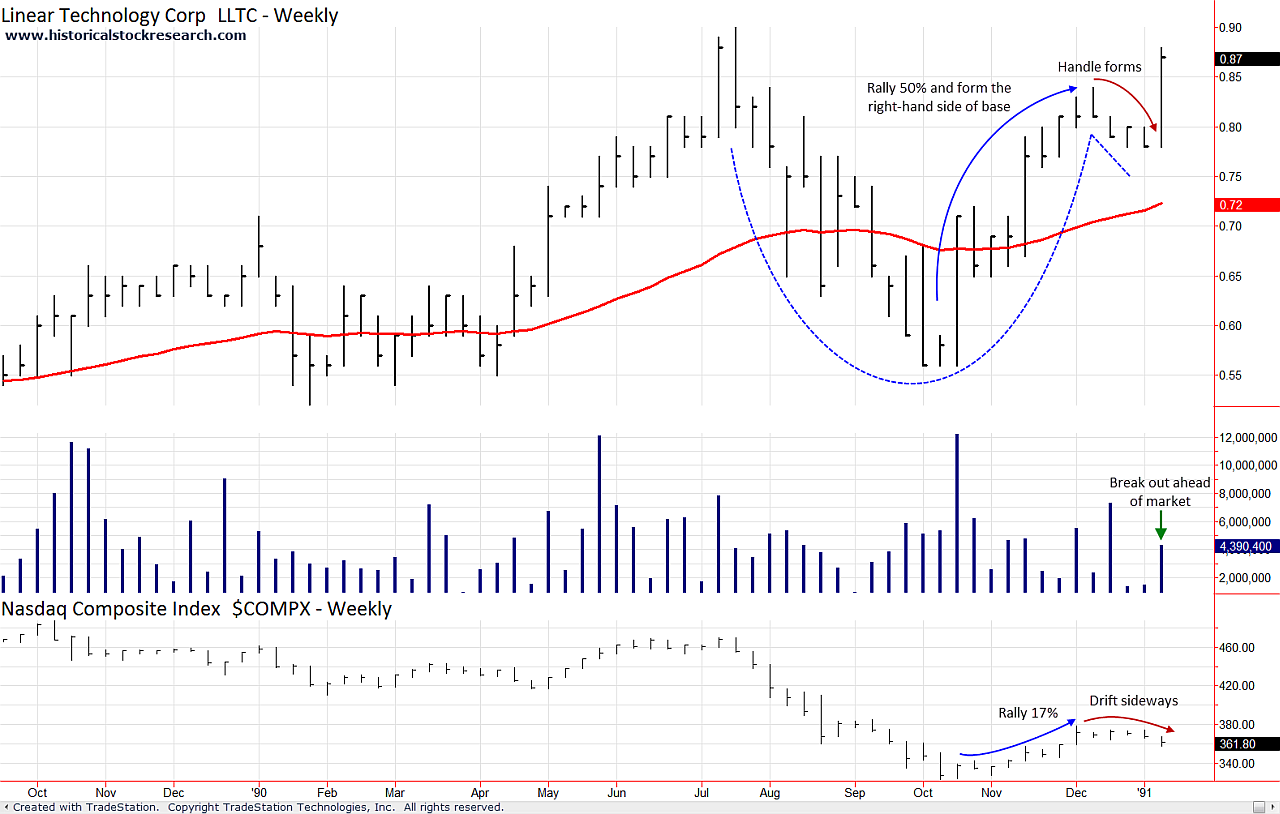
The 1990 Market Bottom occurred after a 34% decline in the Nasdaq Composite that came within striking distance of undercutting its October 1987 low.
Apart from 1987, it was the largest decline in the Nasdaq since the 1973-1974 Bear Market.
From its bear market low on October 12, 1990, to its intermediate high on December 6, 1990, the Nasdaq rallied 17%.
This rally was very important in setting the stage for 1991's explosive move higher that started in earnest on January 16, 1991.
The main reason being that it helped many beaten down stocks quickly climb up the right-hand side of their bases and get into position to provide leadership for the market.
From December 7, 1990 to January 14, 1991 the market drifted sideways.
This price action put the finishing touches on many bases that fueled the market rally, which soared 45% by mid-April 1991.
1990 Market Bottom: Nasdaq Composite Shapes Early Leaders Off the Bottom
|

Click to enlarge
|

Click to enlarge
|
Please click on the links below to see some of the base breakouts from the 1990 Bull Market:
Note the numerous breakouts for the weeks ending 1/18/91 and 1/25/91.
This is when the market began its sprint higher and it nicely demonstrates "the look" at the beginning of a strong market uptrend.
(coming later)
Please >>CLICK HERE<< to go to 1999.
|